Aave meets Twitter: Predicting the price of cryptocurrency using social sentiment analysis
General information
- Author: Yutong Quan, Political Economy (Economics), Class of 2024, Duke Kunshan University
- Instructor: Prof. Luyao Zhang, Duke Kunshan University
- Disclaimer: Submissions to the Final Project for STATS201 Introduction to Machine Learning for Social Science, 2022 Autumn Term (Seven Week - Second) instructed by Prof. Luyao Zhang at Duke Kunshan University.
- Acknowledgments: Firstly, I would like to express my greatest gratitude to Prof. Luyao Zhang for her generous and inspiring instructions on STATS201 Introduction to Machine Learning for Social Science. Also, I would like to thank all my classmates for their valuable comments on this project. I also thank Xin Ma for his assistance in setting up the virtual machine.
Project Summary
- Background & Motivation: Cryptocurrencies have become a popular research subject in financial markets. Since they do not have the fundamental value of the currency, predicting the price of cryptocurrencies is an important and complex question (Mai et al. 2018). Based on the literature, we find that social media sentiment is an important indicator of driving cryptocurrency price movements (Abraham et al. 2018; Aslanidis, Bariviera, and López 2022; Glaser et al. 2014; Kristoufek 2013; Mai et al. 2018; Sabalionis, Wang, and Park 2020). For example, more positive tweets are associated with higher cryptocurrency value (Mai et al. 2018). However, existing research on cryptocurrency price prediction has mainly focused on the two main currencies, Bitcoin and Ethereum, and has not extended to other tokens.
- Research Questions: Our study will focus on Aave, a native utility token of a top-one decentralization finance application on Ethereum, and mainly explore how to predict the price of Aave using social sentiment analysis. Besides, we consider a follow-up question, i.e., what is the relationship between the sentiment polarity of tweets and the price of Aave?
- Application Scenario:
Our raw input variables: The historical time-series data of the monetary value of Aave, and the tweets with specific hashtags.
- Cryptocurrency Data: Our data set comprises daily market prices (AAVE–USD exchange rates) from Alpha Vantage API. We include open price, high price, low price, close price, and daily volume of AAVE from Oct 2020 to Dec 2022 in the dataset.
- Social Media Data: We collect tweets that contained the hashtag (#Aave/#AAVE) from Snscrape API. The timestamp is also from Oct 2020 to Dec 2022.
- Methodology:
- We apply the Valence Aware Dictionary and sEntiment Reasoner (VADER) to quantify the sentiment polarity (positive/negative) and sentiment intensity (-1~1) of tweets.
- We use the Exponential Moving Average (EMA) to measure the volatility of Aave’s price (Mai et al. 2018).
- With the above two methods, we can have our X-variables ready, which are the number of positive/negative tweets and the EMA of Aave’s price. Therefore, we use the Vector Error Correction Model (VECM) to do the regression and thus predict Aave’s price (Mai et al. 2018; Maitra 2020).
- Expected Results: Firstly, we are expected to successfully predict the price of Aave with Twitter using social sentiment analysis. In addition, we expect to find that more positive tweets predict higher Aave prices, while more negative tweets predict lower Aave prices.
- Intellectual Merit & Practical Impacts:
- Firstly, The research project is expected to contribute to combining the fields of combining cryptocurrency forecasting, social sentiment analysis, and econometric methods.
- Secondly, it enriches the research on the Aave token by combining social sentiment with the prediction of Aave’s price for the first time, encouraging more exploration of this token. It has important practical implications to predict the value of Aave more accurately through social sentiment analysis. On the one hand, our results provide a reference for cryptocurrency investors to estimate future price volatility and calculate expected returns. On the other hand, policymakers can disentangle the forces behind cryptocurrencies to craft regulations and curb financial stability risks.
- Thirdly, our research inspires research on other ERC-20 (Ethereum Request for Comments 20) tokens, since they have almost the same token standard as Aave.
- In addition, our study has limitations in dealing with manipulation issues and user behavioral bias. We do not consider the deviation of too many negative tweets caused by robot manipulation and users’ subjective malicious evaluation, and its adverse impact on the prediction of token price. Future research could take these disturbing factors into account to achieve more accurate price predictions.
Table of Contents
Data
| Cryptocurrency Data | Social Media Data | |
|---|---|---|
| Data Source | Alpha Vantage API | Snscrape API |
| Queried Data | Aave_Queried | - |
| Processed Data | Aave_Processed | - |
Code
Spotlight
Poster
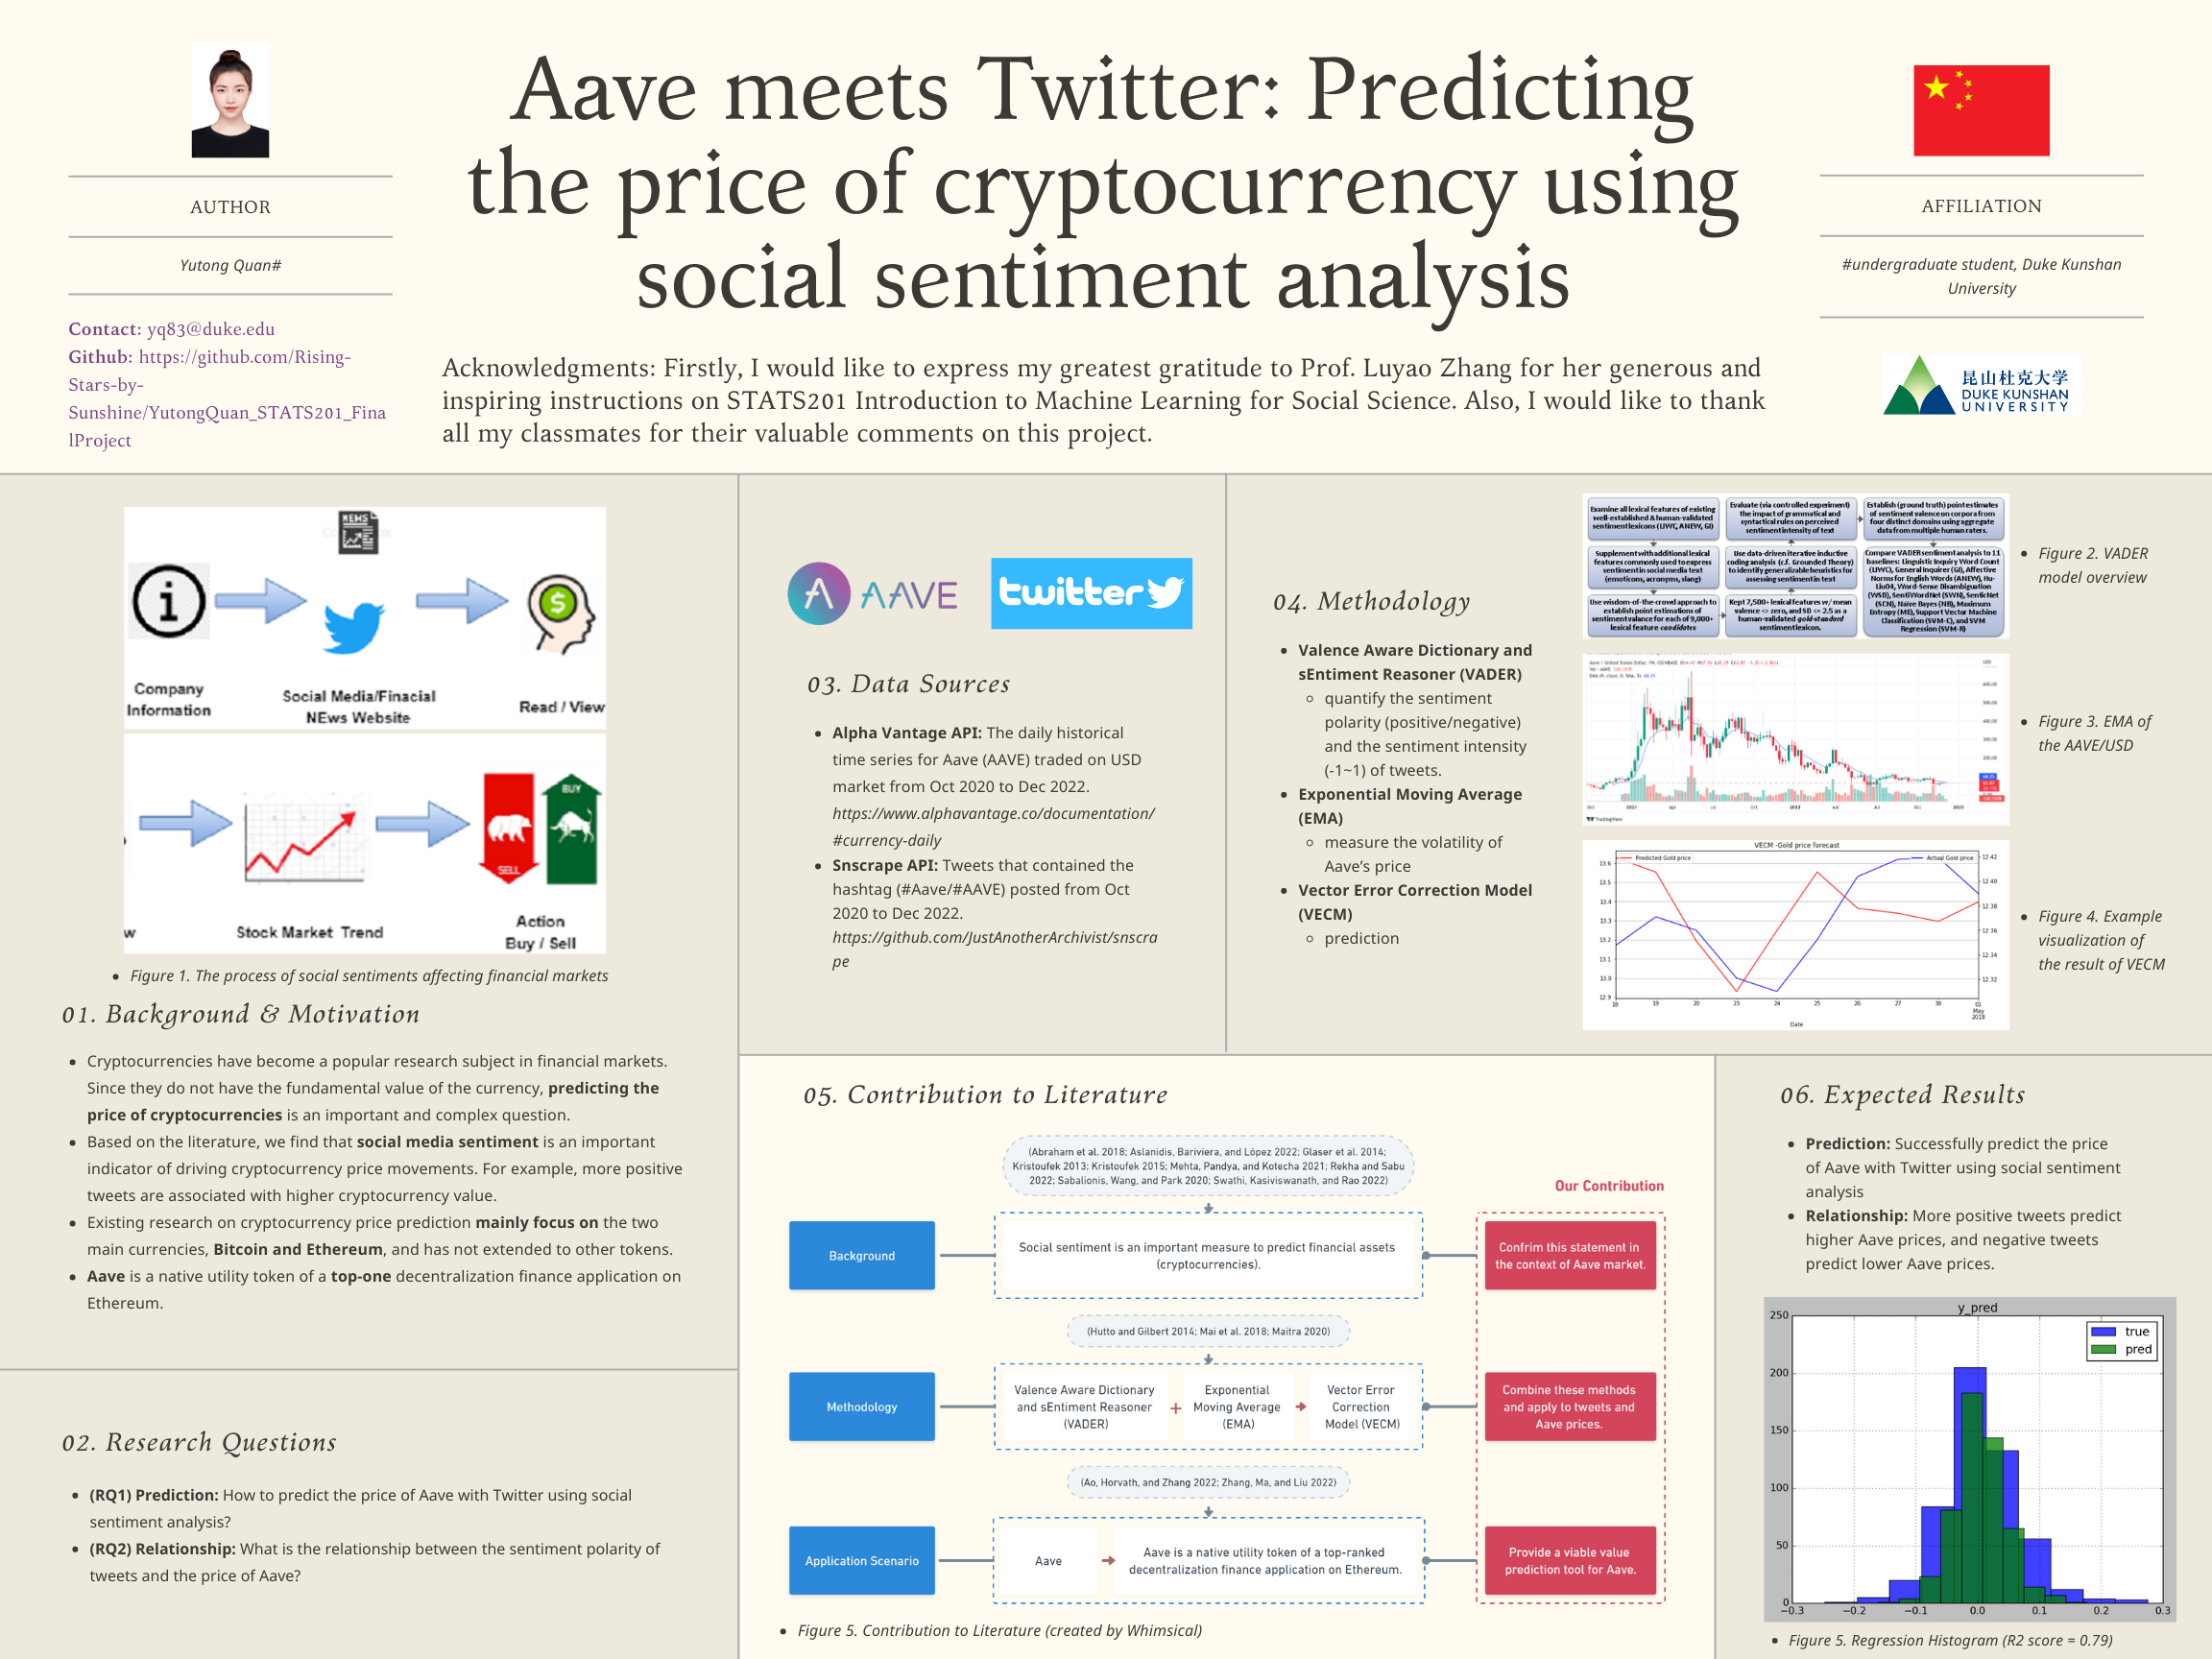 Figure No.1. Project Poster (created by Canva)
Figure No.1 demonstrates the six sections of our research summary: Background and Motivation, Research Questions, Data Sources, Methodology, Contribution to Literature, and Expected Results.
Literature Review
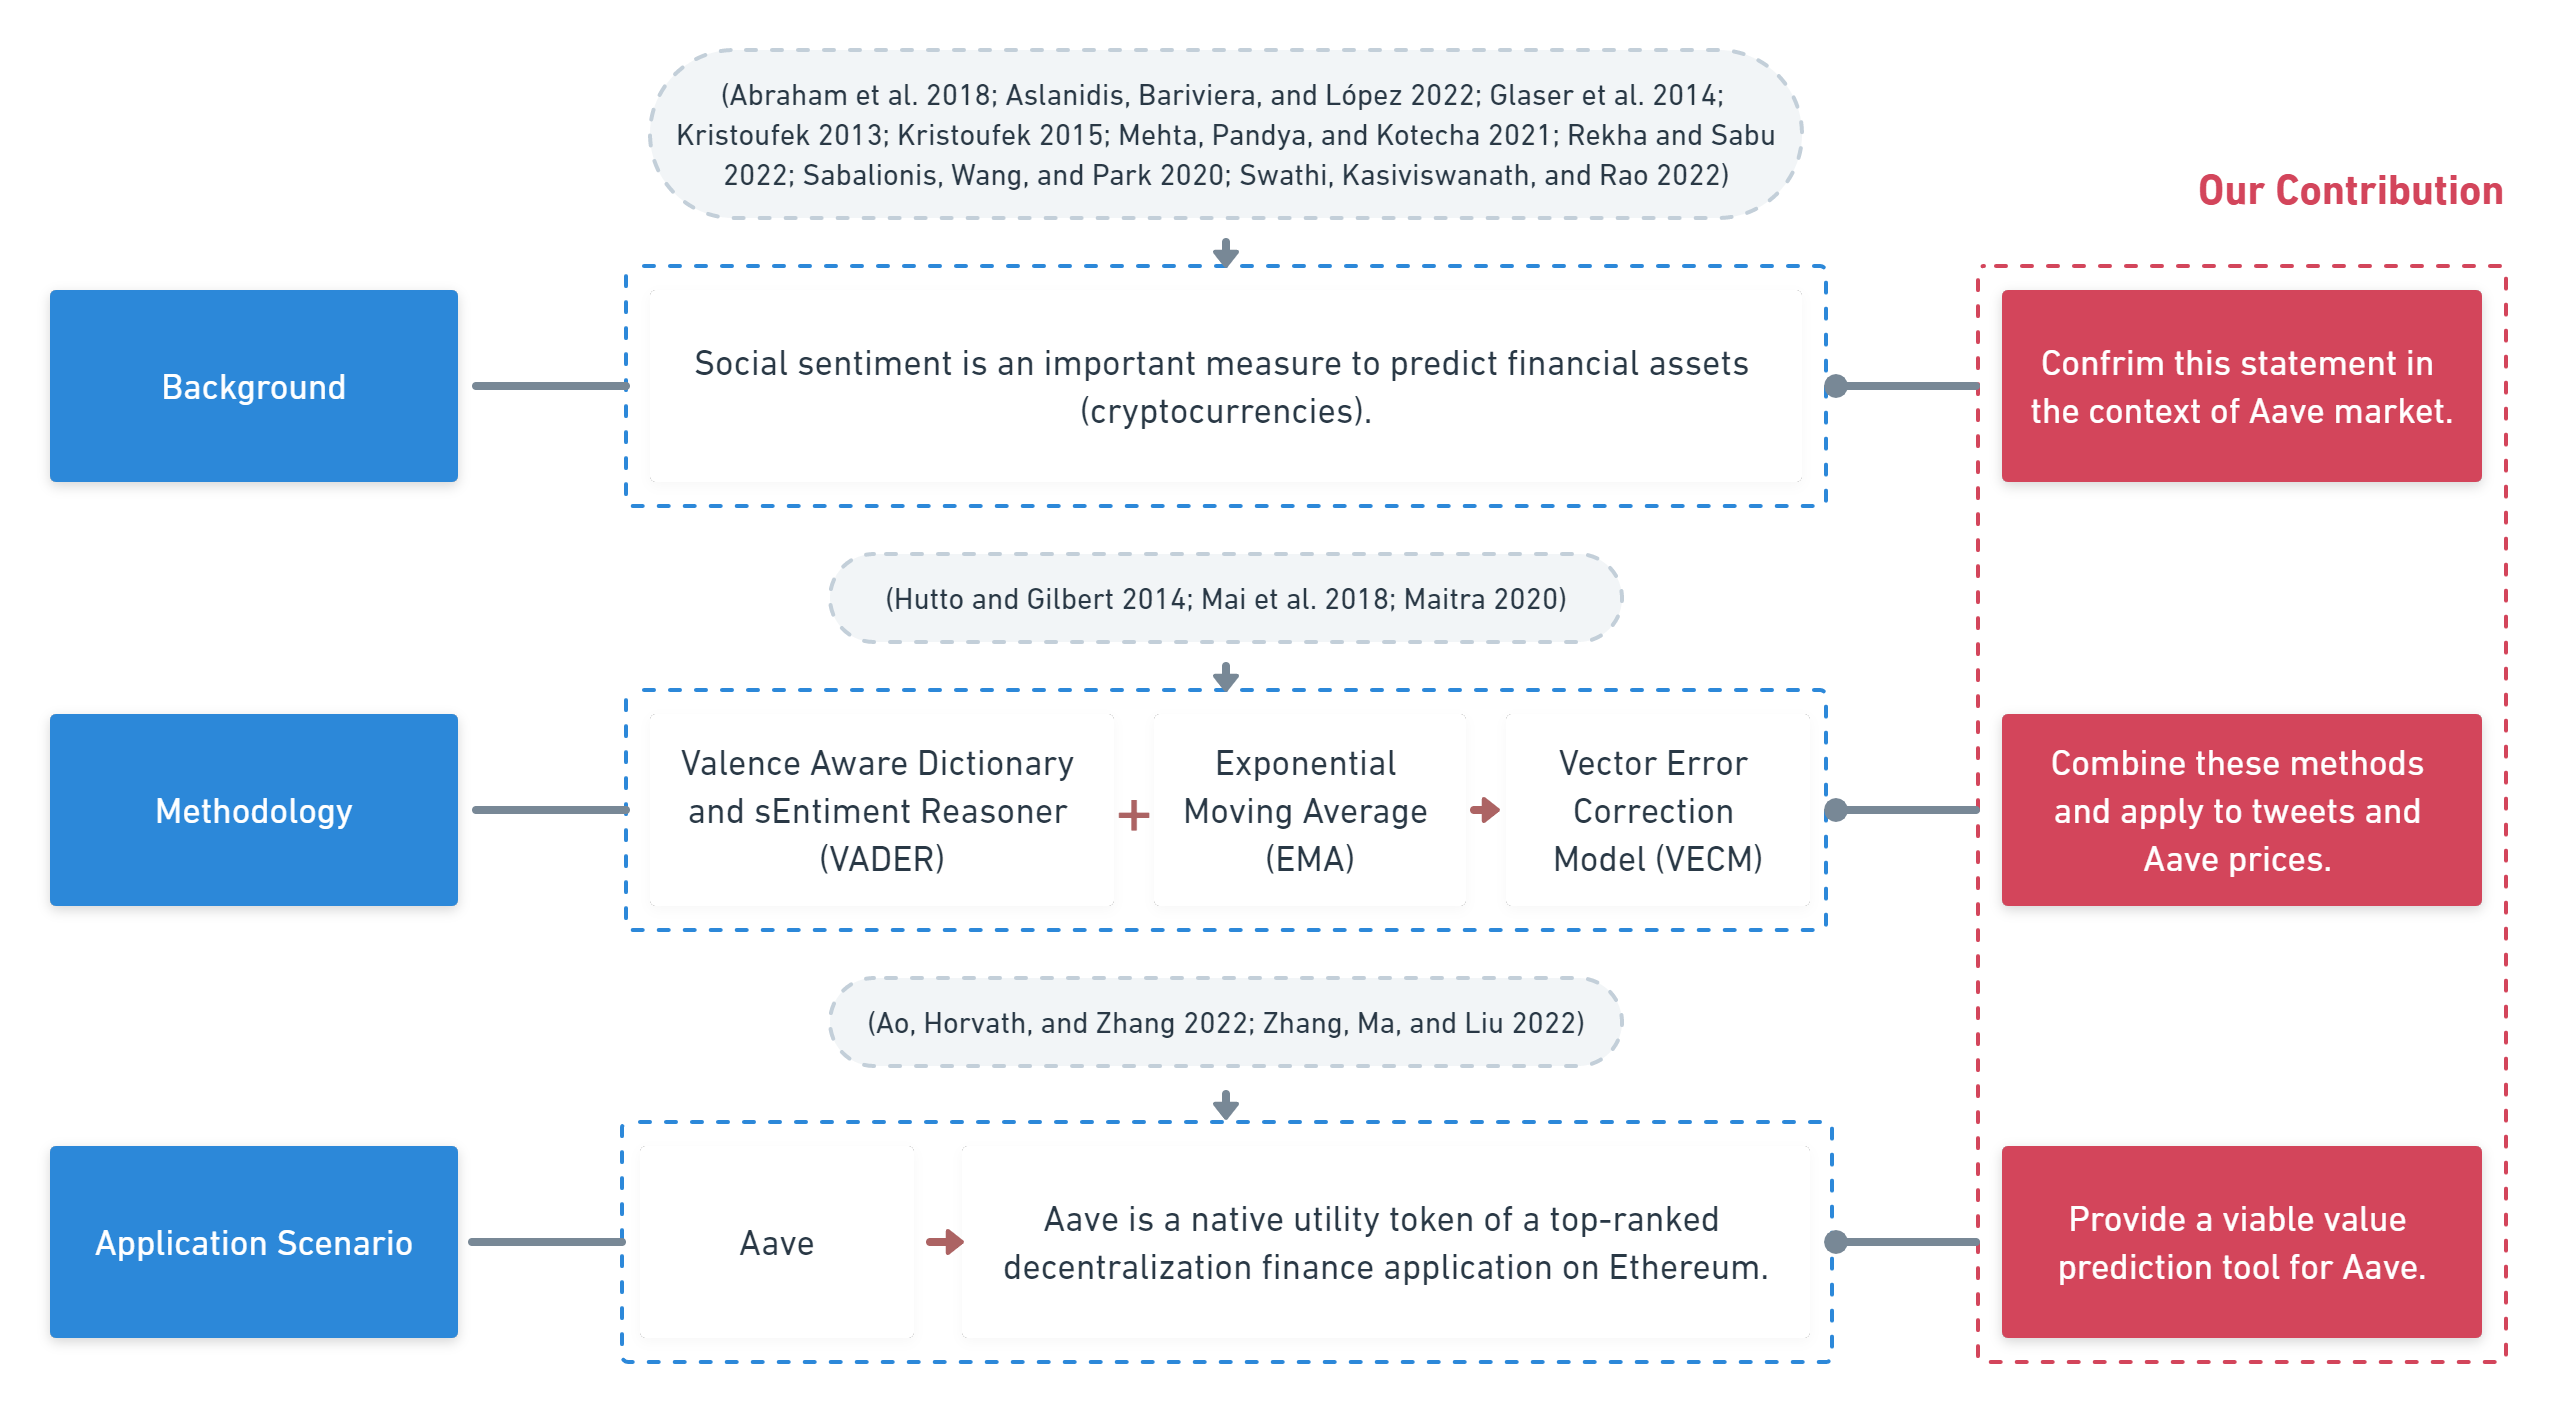
Figure No.2. Contribution to Literature (created by Whimsical)
Figure No.2 provides a brief outline of the literature review in terms of research background, methodology, and application scenario, as well as the contribution our project makes to the existing literature.
Explanation Figure
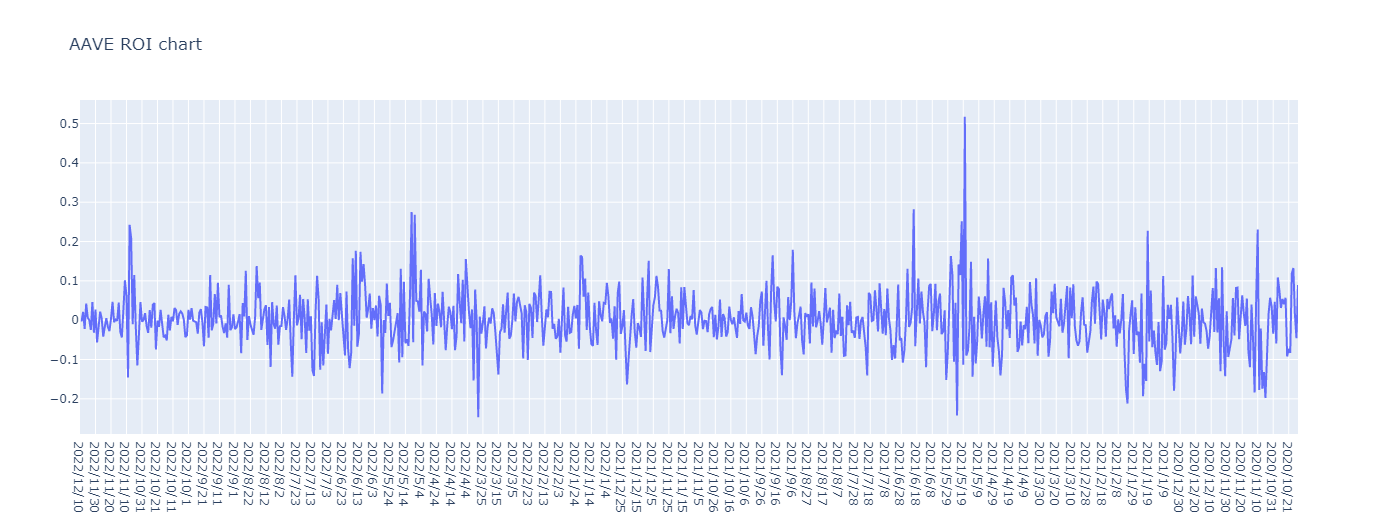
Figure No.3. The Time-Series ROI chart of Aave (source from Alpha Vantage: Digital & Crypto Currencies/DIGITAL_CURRENCY_DAILY, created by Plotly)
Figure No.3 is the time-series chart of Aave’s return on investment (ROI) from Oct 2020 to Dec 2022. The X-axis shows the timestamp and the Y-axis shows the ROI value of Aave (-0.2~0.5). The ROI line fluctuates around Y=0. When the line fluctuates upward, the ROI of Aave is larger; and when the line fluctuates downward, the ROI is smaller. Also, We should note that the X-axis from right to left represents the time closer to the present. From this figure, we can find that on May 18, 2021, Aave has the highest ROI of 0.52. And on March 28, 2022, Aave has the lowest ROI of -0.25.
Prediction Figures
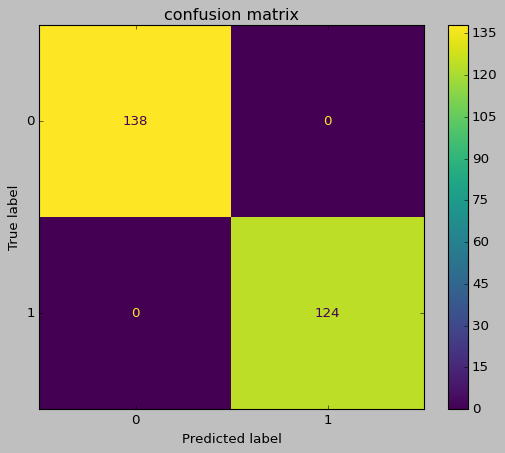
Figure No.4. The Confusion Matrix for Random Forest Classification (source from Alpha Vantage: Digital & Crypto Currencies/DIGITAL_CURRENCY_DAILY, created by sklearn.ensemble.RandomForestClassifier)
Figure No.4 is the confusion matrix of Random Forest Classification algorithm for Aave daily return on investment (ROI) prediction. The confusion matrix provides an evaluation of the performance of the classification algorithm we use. For the data set we used for prediction, the X variable is the past 30-day moving average of the daily return on investment of Aave, and the Y variable is the future return on investment (where ROI>0 = positive, and ROI<0 = negative). In this matrix, the X-axis is the predicted label and the Y-axis is the true label, where 0 indicates a negative ROI and 1 indicates a positive ROI. As it approaches yellow, the number is larger, and as it approaches purple, the number is smaller. The figure shows that our model correctly classifies all 124 Positive ROI cases (True Positive), and all 138 negative ROI cases (True Negative). The model accuracy is (TP + TN)/(TP + TN + FP + FN) = 262/262 = 1, the recall is TP/(TP + FN) = 124/124 = 1, and the precision is TP/(TP + FP) = 124/124 = 1 (Formula reference: Krukrubo 2019).
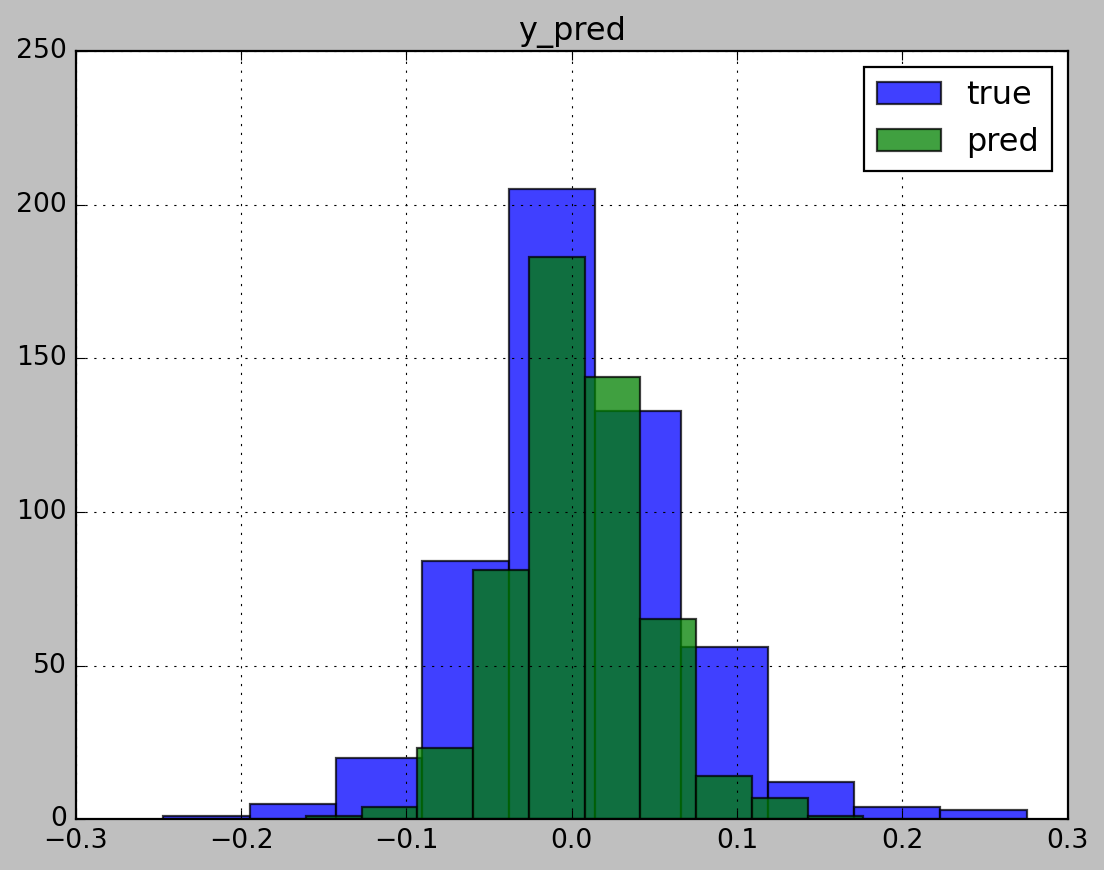
Figure No.5. The Regression Histogram for Random Forest Regression (source from Alpha Vantage: Digital & Crypto Currencies/DIGITAL_CURRENCY_DAILY, created by sklearn.ensemble.RandomForestRegressor)
Figure No.5 is the histogram of Random Forest Regression algorithm for Aave return on investment (ROI) prediction. The histogram provides an evaluation of the performance of the regression algorithm we use. For the data set we used for prediction, the X variable is the past 30-day moving average of the daily return on investment of Aave, and the Y variable is the future return on investment. In this figure, the X-axis is the predicted ROI value of Aave and the Y-axis is the amount of data set, where a larger number means more predicted values in this interval, while a smaller number means fewer predicted values. Blue represents the true rate of return and green represents our predicted rate of return. The figure shows that the blue and green squares are highly overlapping, which means that the predicted results are highly close to the true results. In addition, the R2 score is equal to 0.79 (the closer to 1, the better), which also indicates the high accuracy of our model.
More about the Author

- Self Introduction: Yutong Quan is a junior student majoring in Political Economy with an Economics track at Duke Kunshan University. She is interested in Finance, Artificial intelligence, Blockchain, and Behavior Economics.
- Final Reflections: The discussion on applying machine learning methods to solve social science problems can be divided into four parts. The first part is data explanation. We can use a variety of data visualization methods, including histograms and heatmaps, to communicate social science problems to the public more concisely and clearly, which is also convenient for us to conduct further analysis and interpretation. The second part is the data prediction. We input historical data containing X variables and Y variables into the machine and then use supervised machine learning algorithms to learn the data and results, thus figuring out the possibility we successfully predict the true value. Data prediction provides a good tool for us to solve prediction problems in social sciences by traversing a large amount of historical data and looking for internal laws. For example, we can use historical stock prices to predict future stock market movements and provide decision suggestions for investors, companies, and governments. The third part is causal inference. We conduct causal inference when social scientists want to explore the reasons why one variable in a system may affect another. Based on massive data and algorithms, machine learning evaluates the causal effect of each predictor variable on the outcome, making it more convenient to determine the causality. The last part is optimization, which is to find the strategy which maximizes our objectives based on a decision environment of state-action-reward pairs. By using a reinforcement learning algorithm and inputting our objectives, the machine can help to find the best strategy even though the detailed environment may change. The use of machine learning to find optimal solutions is widespread. One example is using artificial intelligence to find the portfolio that achieves the best performance. (Reference: Machine Learning for Social Science: Match the right tool to the job)
References
Data Source
Alpha Vantage: Digital & Crypto Currencies/DIGITAL_CURRENCY_DAILY
Code Source
stats201-tutorial-prediction/code
SoK_Blockchain_Decentralization/code
Articles
“Cryptocurrency Price Prediction Using Tweet Volumes and Sentiment Analysis.”
“The Link between Cryptocurrencies and Google Trends Attention.”
“Bitcoin - Asset or Currency? Revealing Users’ Hidden Intentions.”
“VADER: A Parsimonious Rule-Based Model for Sentiment Analysis of Social Media Text.”
“What Are the Main Drivers of the Bitcoin Price? Evidence from Wavelet Coherence Analysis.”
“How Does Social Media Impact Bitcoin Value? A Test of the Silent Majority Hypothesis.”
“Time-Series Analysis with VAR & VECM: Statistical Approach with Complete Python Code.”
“Harvesting Social Media Sentiment Analysis to Enhance Stock Market Prediction Using Deep Learning.”
“What Affects the Price Movements in Bitcoin and Ethereum?”
“An Optimal Deep Learning-Based LSTM for Stock Price Prediction Using Twitter Sentiment Analysis.”
Literature
Abraham, Jethin, Daniel Higdon, John Nelson, Juan Ibarra, and Jack Nelson. 2018. “Cryptocurrency Price Prediction Using Tweet Volumes and Sentiment Analysis.” SMU Data Science Review 1 (3). https://scholar.smu.edu/cgi/viewcontent.cgi?article=1039&context=datasciencereview.
Ao, Ziqiao, Gergely Horvath, and Luyao Zhang. 2022. “Are Decentralized Finance Really Decentralized? A Social Network Analysis of the Aave Protocol on the Ethereum Blockchain.” Arxiv.org, June. https://doi.org/10.48550/arXiv.2206.08401.
“API Documentation: Alpha Vantage.” 2022. Www.alphavantage.co. 2022. https://www.alphavantage.co/documentation/#currency-daily.
Aslanidis, Nektarios, Aurelio F. Bariviera, and Óscar G. López. 2022. “The Link between Cryptocurrencies and Google Trends Attention.” Finance Research Letters 47 (June): 102654. https://doi.org/10.1016/j.frl.2021.102654.
“ERC-20 Token Standard.” 2022. Ethereum.org. August 15, 2022. https://ethereum.org/en/developers/docs/standards/tokens/erc-20/#top.
Glaser, Florian, Kai Zimmermann, Martin Haferkorn, Moritz Christian Weber, and Michael Siering. 2014. “Bitcoin - Asset or Currency? Revealing Users’ Hidden Intentions.” Ssrn.com. 2014. https://papers.ssrn.com/sol3/papers.cfm?abstract_id=2425247.
HCI-Blockchain. 2022. “Sentiment Analysis for Blockchain and Beyond.” GitHub. August 21, 2022. https://github.com/HCI-Blockchain/SentimentAnalysis.
Hutto, C., and Eric Gilbert. 2014. “VADER: A Parsimonious Rule-Based Model for Sentiment Analysis of Social Media Text.” Proceedings of the International AAAI Conference on Web and Social Media 8 (1). https://ojs.aaai.org/index.php/ICWSM/article/view/14550.
JustAnotherArchivist. 2020. “JustAnotherArchivist/Snscrape.” GitHub. December 22, 2020. https://github.com/JustAnotherArchivist/snscrape.
Kristoufek, Ladislav. 2013. “BitCoin Meets Google Trends and Wikipedia: Quantifying the Relationship between Phenomena of the Internet Era.” Scientific Reports 3 (1). https://doi.org/10.1038/srep03415.
———. 2015. “What Are the Main Drivers of the Bitcoin Price? Evidence from Wavelet Coherence Analysis.” Edited by Enrico Scalas. PLOS ONE 10 (4): e0123923. https://doi.org/10.1371/journal.pone.0123923.
“Live Stock, Index, Futures, Forex and Bitcoin Charts on TradingView.” 2022. TradingView. 2022. https://www.tradingview.com/chart.
Mai, Feng, Zhe Shan, Qing Bai, Xin (Shane) Wang, and Roger H.L. Chiang. 2018. “How Does Social Media Impact Bitcoin Value? A Test of the Silent Majority Hypothesis.” Journal of Management Information Systems 35 (1): 19–52. https://doi.org/10.1080/07421222.2018.1440774.
Maitra, Sarit. 2020. “Time-Series Analysis with VAR & VECM: Statistical Approach with Complete Python Code.” Medium. October 17, 2020. https://towardsdatascience.com/vector-autoregressions-vector-error-correction-multivariate-model-a69daf6ab618.
Mehta, Pooja, Sharnil Pandya, and Ketan Kotecha. 2021. “Harvesting Social Media Sentiment Analysis to Enhance Stock Market Prediction Using Deep Learning.” PeerJ Computer Science 7 (April): e476. https://doi.org/10.7717/peerj-cs.476.
Rekha, KS, and MK Sabu. 2022. “A Cooperative Deep Learning Model for Stock Market Prediction Using Deep Autoencoder and Sentiment Analysis.” PeerJ Computer Science 8 (November): e1158. https://doi.org/10.7717/peerj-cs.1158.
Sabalionis, Arturas, Wenbo Wang, and Hail Park. 2020. “What Affects the Price Movements in Bitcoin and Ethereum?” The Manchester School, November. https://doi.org/10.1111/manc.12352.
SciEcon. 2021. “SRS2021/More about the Paper/Sentiment Analysis at Main · SciEcon/SRS2021.” GitHub. 2021. https://github.com/SciEcon/SRS2021/tree/main/More%20about%20the%20paper/Sentiment%20Analysis.
Swathi, T., N. Kasiviswanath, and A. Ananda Rao. 2022. “An Optimal Deep Learning-Based LSTM for Stock Price Prediction Using Twitter Sentiment Analysis.” Applied Intelligence, March. https://doi.org/10.1007/s10489-022-03175-2.
Zhang, Luyao. 2022. “Machine Learning for Social Science: Match the Right Tool to the Job.” Whimsical. 2022. https://whimsical.com/machine-learning-for-social-science-match-the-right-tool-to-the–8zuA7Bg5bYQPkRgMJCoywA.
Zhang, Luyao (Sunshine). 2022a. “Machine Learning for Social Science.” Machine Learning for Social Science. https://ms.pubpub.org/.
———. 2022b. “Machine Learning for Predictions.” Machine Learning for Social Science, November. https://ms.pubpub.org/pub/ml-prediction/release/3.
Zhang, Luyao, Xinshi Ma, and Yulin Liu. 2022. “SoK: Blockchain Decentralization.” ArXiv:2205.04256 [Cs, Econ, Q-Fin], May. https:/